Business model and strategy
Galliford Try operates across the UK as a standalone construction group, carrying out work primarily as Galliford Try and Morrison Construction.
Our business is organised into three areas: Building, Infrastructure and Specialist Services.
Building operates across the UK, designing, constructing and refurbishing assets across markets where we have proven expertise and significant opportunities, particularly the education, health, defence, justice and commercial sectors.
The Infrastructure division comprises our Environment and Highways businesses, which carry out vital civil engineering projects across the UK. Environment covers the water and sewage sectors, where we are one of the largest players and carry out capital delivery and maintenance, and asset optimisation. Our work in Highways has contributed substantially to the national infrastructure network, from major project delivery of large-scale schemes to delivering road surfacing works and maintenance as a leading player.
Specialist Services includes our fire stopping and cladding business Oak Specialist Services; our active security business Asset Intelligence; Investments; Facilities Management and Digital Infrastructure, Investments has historically specialised in managing construction through to operations for major building projects via public private partnerships. These skill sets are now being used to progress co-development opportunities, with a focus on the PRS (Private Rented Sector). Our expertise in leading bid consortia and arranging finance to devise and secure the right solution on an individual basis makes us attractive to clients.
Our Facilities Management business works with Building, with an emphasis on the education and health sectors. Our capabilities include delivering high-quality, full life-cycle solutions to our clients, including green retrofit.
Our network of regional offices is a key advantage, offering clients the benefit of national strength with local delivery and we are focused on sectors where we have proven strengths, operating predominantly in the public and regulated sectors.
Prior to 2020, Galliford Try was a construction, housebuilding and regeneration group. The business disposed of its housebuilding divisions Linden Homes and Galliford Try Partnerships on 3 January 2020 becoming a well-capitalised, standalone construction-focused group.
In 2021, Galliford Try announced its Sustainable Growth Strategy and acquired the water business of nmcn, including Lintott, following administration of the company. Further acquisitions have included MCS Control Systems, Ham Baker Engineering and AVRS Systems.
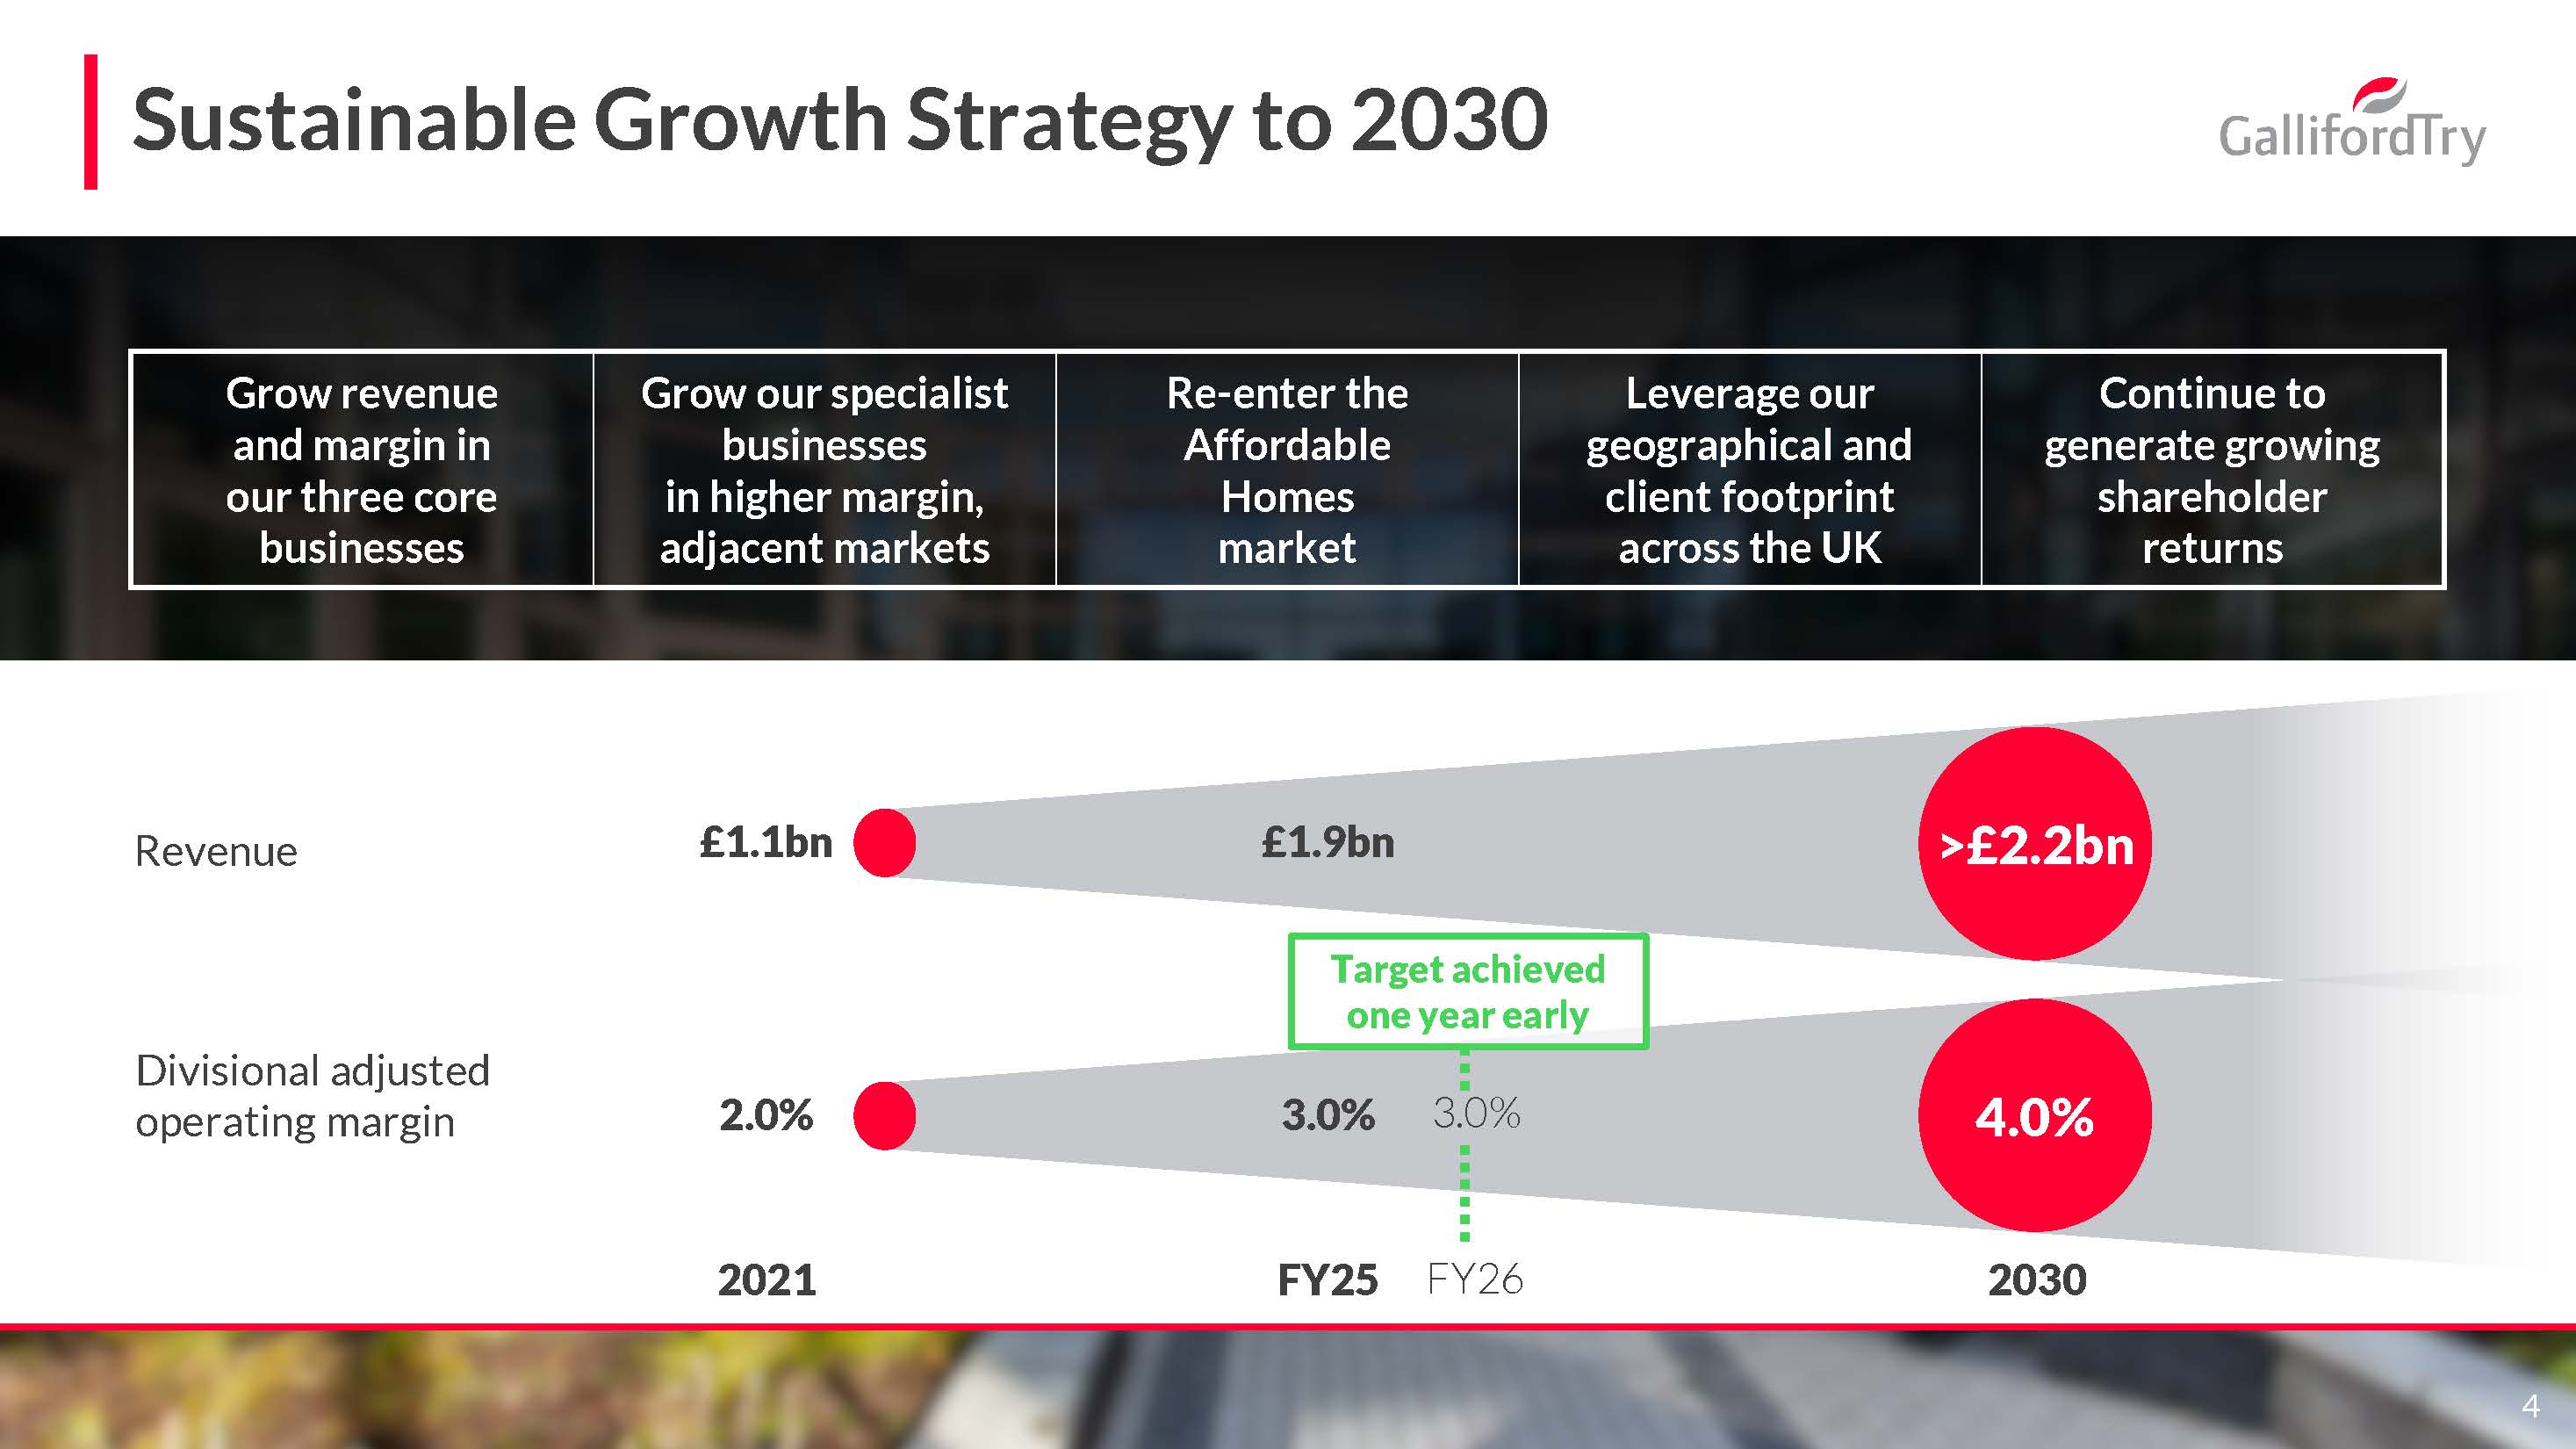
Sustainable Growth Strategy to 2030
In May 2024, Galliford Try announced its 2030 strategy, targeting in excess of £2.2bn in revenue and a divisional operating margin of 4.0%, having accelerated its strategy to 2026 ahead of programme and with the margin goal rising from 3.0% to 4.0%.
The new strategy is founded on the imperative to renew and improve the UK’s social and economic infrastructure, concentrating on three main aspects of our business.
|
Sustainability pillar |
Objective |
KPI |
FY24 |
FY25 |
Ambition |
|
Health and safety |
Prioritising health, safety and wellbeing and ensuring no harm to anyone linked with our operations. |
Lost Time Frequency Rate
|
0.14 |
0.09 |
No harm. |
|
Accident Frequency Rate
|
0.04 |
0.03 |
No harm. |
||
|
Our people |
Creating an inclusive environment and progressive culture that enables all individuals to reach their potential. |
Early careers as a % of total employees |
10.2% |
10.1% |
>9.0% |
|
Women as a % of total employees |
22.5% |
23.0% |
Year-on-year increase. |
||
|
Employee advocacy |
87% |
87% |
>80% |
||
|
|
|||||
|
Environment and climate change |
Adopting sustainable resourcing and consumption practices and taking measures to mitigate carbon production and climate change to protect our environment and biodiversity. |
Scope 1 and 2 carbon emissions (CO2e tonnes) |
10,486 |
14,811 |
Net zero by 2030. |
|
Scope 3 carbon emissions (CO2e tonnes) |
7,128 |
8,874 |
Net zero by 2045. |
||
|
Waste intensity (tn/£100k revenue) |
17.7 |
12.4 |
Year-on-year reduction. |
||
|
Communities |
Making a positive impact in communities where we operate by delivering greater social value and improving lives. |
% of completed projects delivering >25% SLEV as a % of contract value |
79% |
83% |
60% |
|
Considerate Constructors Scheme performance |
42.9 (industry ave 40.6) |
43.9 |
>39 and above industry average. |
||
|
|
|||||
|
Clients |
Delivering lower carbon, superior buildings and infrastructure with a better social footprint for clients in our chosen markets through a focus on innovation, digitalisation and quality. |
% of repeat business in our order book |
92% |
93% |
>80% |
|
% of full year planned revenue secured at the start of the financial year |
92% |
92% |
>85% |
||
|
Supply chain |
Aligning our supply chain with our culture and creating collaborative relationships that deliver best practice, innovation and sustainable outcomes for clients, communities and the environment. |
% of business unit core trades spend with Aligned subcontractors |
61% |
59% |
70%–80% |
|
Prompt payment – % of invoices paid within 60 days |
96% |
97% |
>95% |
||
|
|
FY24 |
FY25 |
2030 target |
||
|
Divisional operating margin |
Focus on both top and bottom line growth and accelerated growth in our higher-margin adjacent market businesses. |
2.5% |
3.0% |
4.0% |
|
|
Revenue |
Maintaining disciplined contract selection and robust risk management in resilient market sectors. |
£1.8bn |
£1.9bn |
>£2.2bn |
|
|
Average month-end cash |
Retain a strong balance sheet and operating cash generation |
£155m |
£179m |
Operating cash generation |
|
|
Dividend cover |
Sustainable dividends with earnings cover of 1.8x. |
1.8x earnings cover |
1.8x earnings cover |
1.8x earnings cover |
|